Research prototype — not for clinical use. MSc dissertation project; results are internal validation and one external transportability check, not a clinical claim.
Predicting heart
failure outcomes,
honestly.
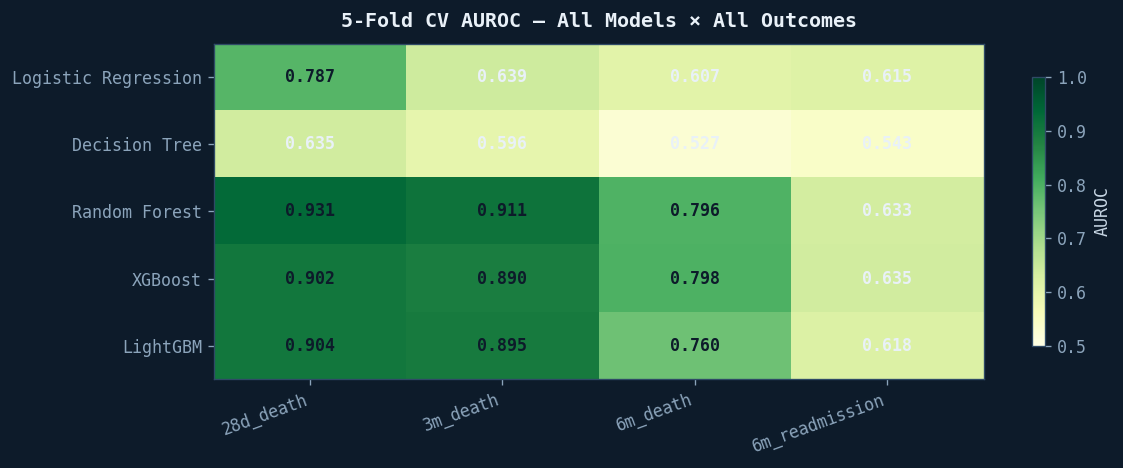
Five models, four outcome horizons, 2,008 patients — and a full leakage audit that cut the headline AUROC from 0.819 to 0.710 before I believed a single digit of it.
0
Zhang patients
Heart-failure clinical records
0
Final predictors
After the leakage audit
0
MIMIC-IV patients
External transportability set
0
Analysis scripts
Reproducible pipeline
The live prototype
Now runs the real models.
The deployed Streamlit app serves the audited pipeline — same 143 predictors, same thresholds, with a research-only framing.
Launch the live HF-RISK tool in its own workspace
Real inference
Same pipeline as the dissertation.
Live SHAP
Per-patient explanations on demand.
Research-safe
Framed as prototype, never advice.
The audit
Higher AUROC isn't better if it's not honest.
An earlier pass reached 0.819 at six months. The audit found features that leak the future — and the honest number is 0.710 internal, 0.599 external.
Before audit
0.819
After audit
0.710
Removed as leakage
- Unnamed: 0
- inpatient.number
- dischargeDay
- outcome.during.hospitalization
- readmission & emergency-return timing proxies
Every removed feature was available only after the outcome was already decided — perfect hindsight, zero clinical value.
Results
The numbers that survive scrutiny.
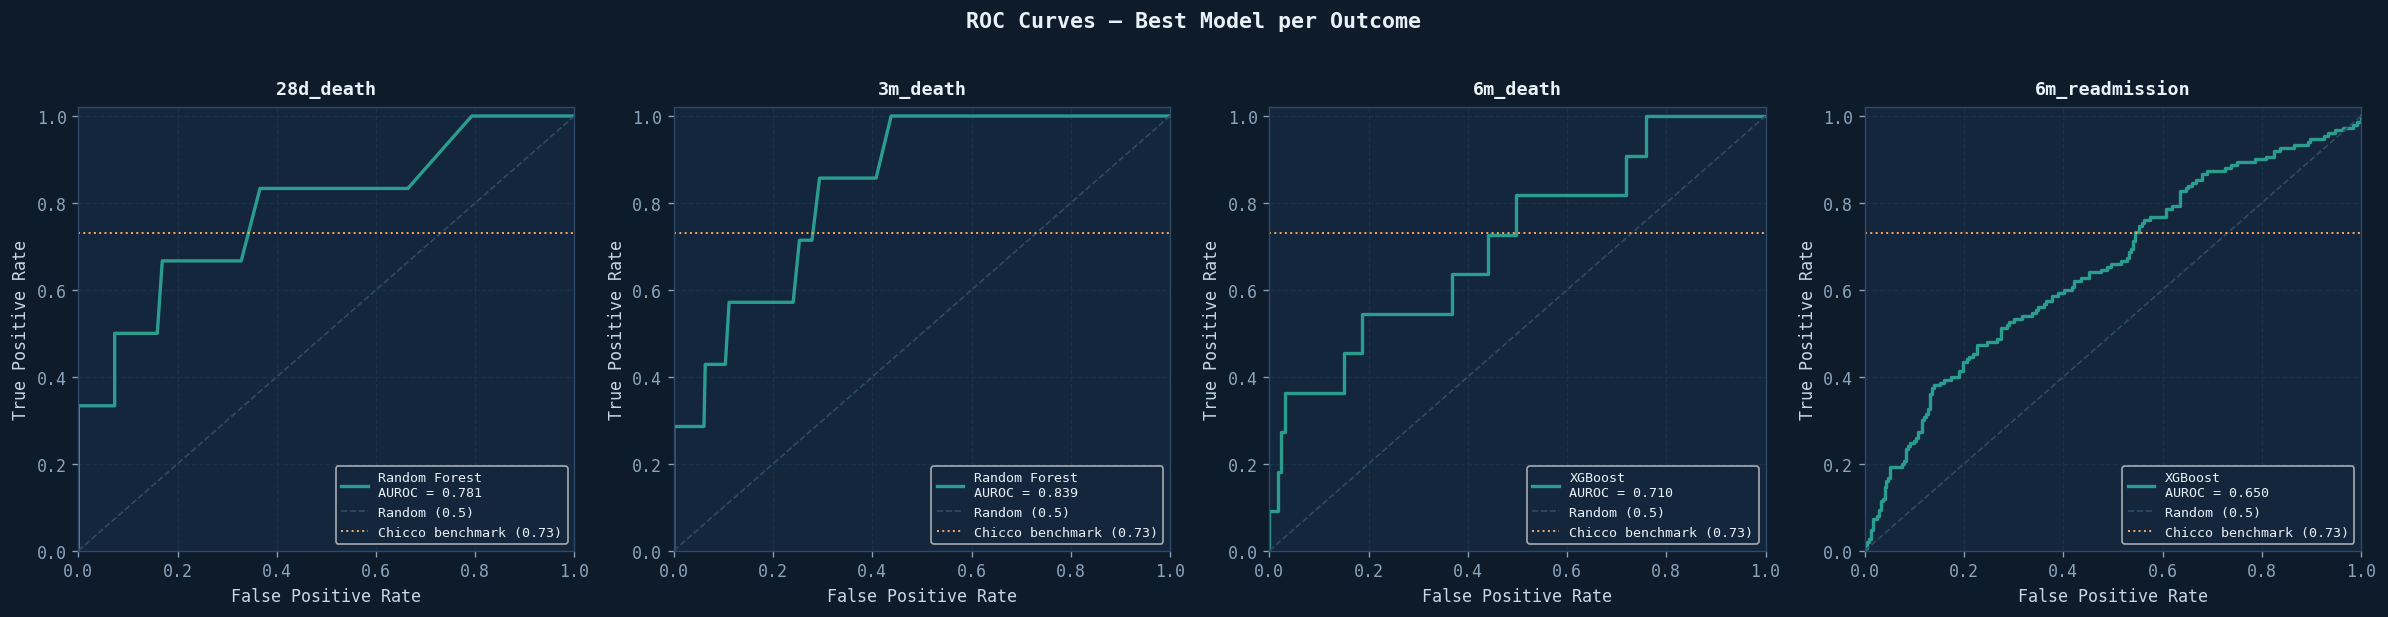
Held-out Zhang cohort, four horizons, two model families.
0.781
28-day mortality
Random Forest
0.839
3-month mortality
Random Forest
0.710
6-month mortality
XGBoost
0.650
6-month readmission
XGBoost
Process
Five weeks, four tracks.
Develop, audit, explain, validate — in parallel, not in series.
- Step 01
Develop
Five candidate models, consistent splits, no peeking.
- Step 02
Audit
Feature-by-feature leakage review against the data dictionary.
- Step 03
Explain
SHAP reduction to 143 predictors that carry the signal.
- Step 04
Validate
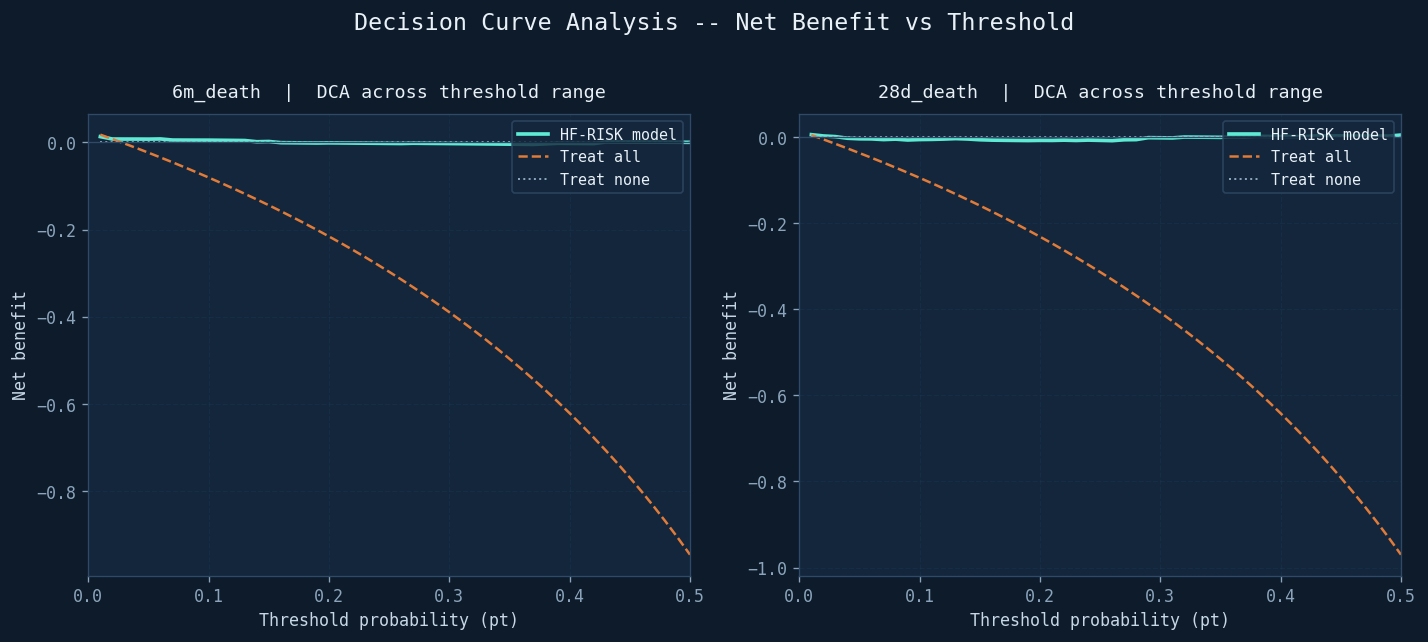
Held-out cohort, MIMIC-IV transfer, calibration, DCA, subgroups.
Feb 20–27
Foundations & literature
Feb 28 – Mar 4
Exploratory analysis
Mar 4–8
Preprocessing & features
Mar 9–14
Modelling & comparison
Mar 14–18
Explainability & tool
Mar 18–20
Outreach & dissertation
Explainability
What the final model actually pays attention to.
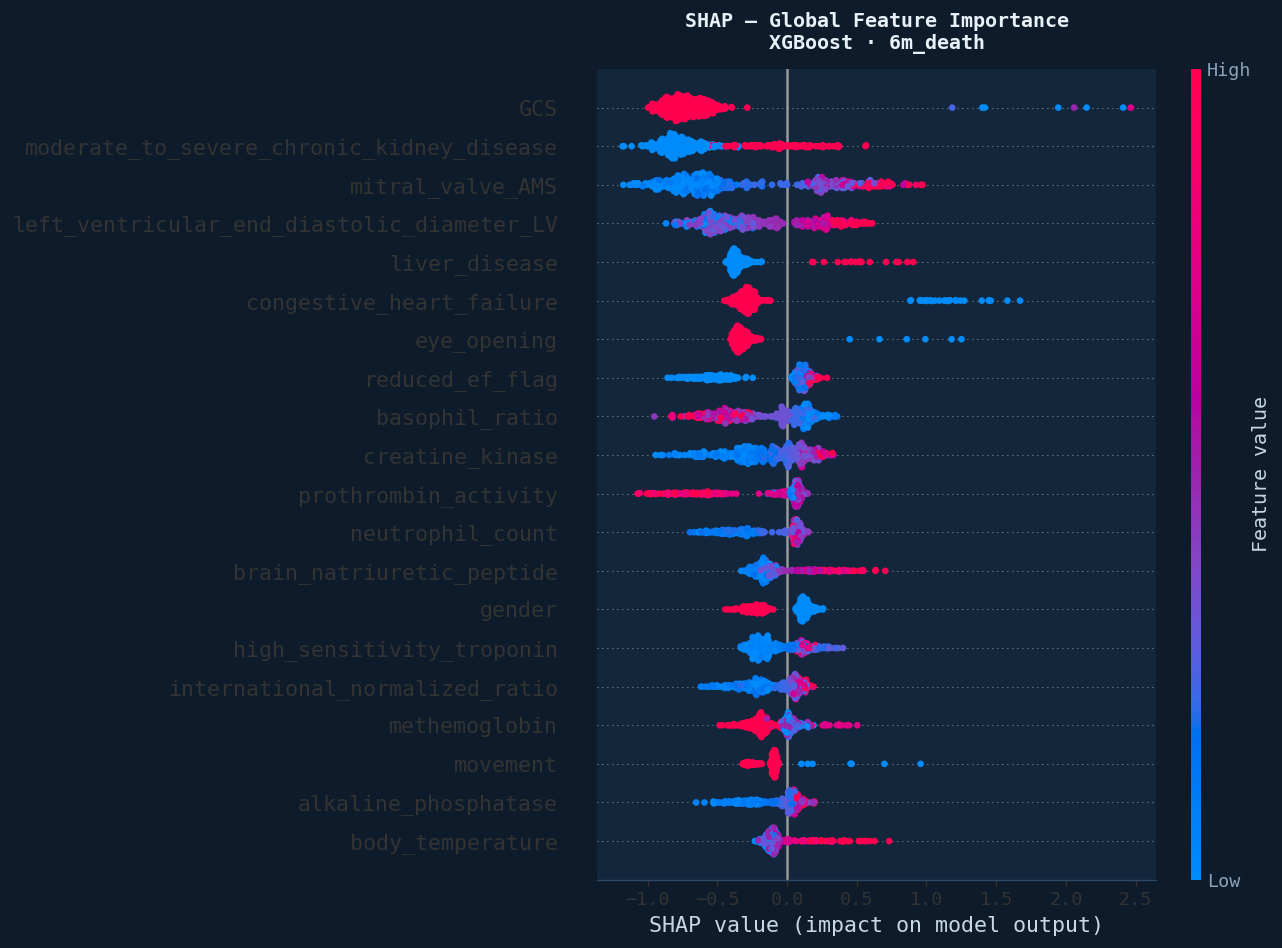
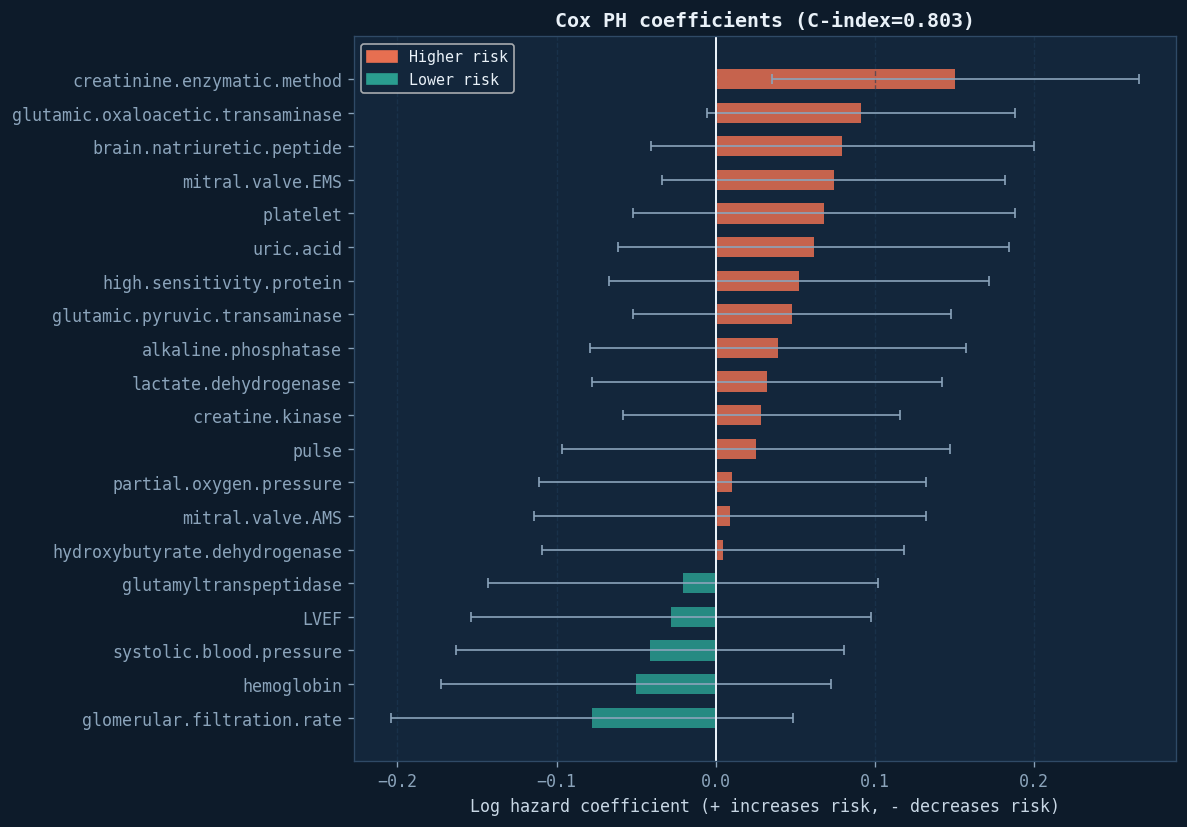
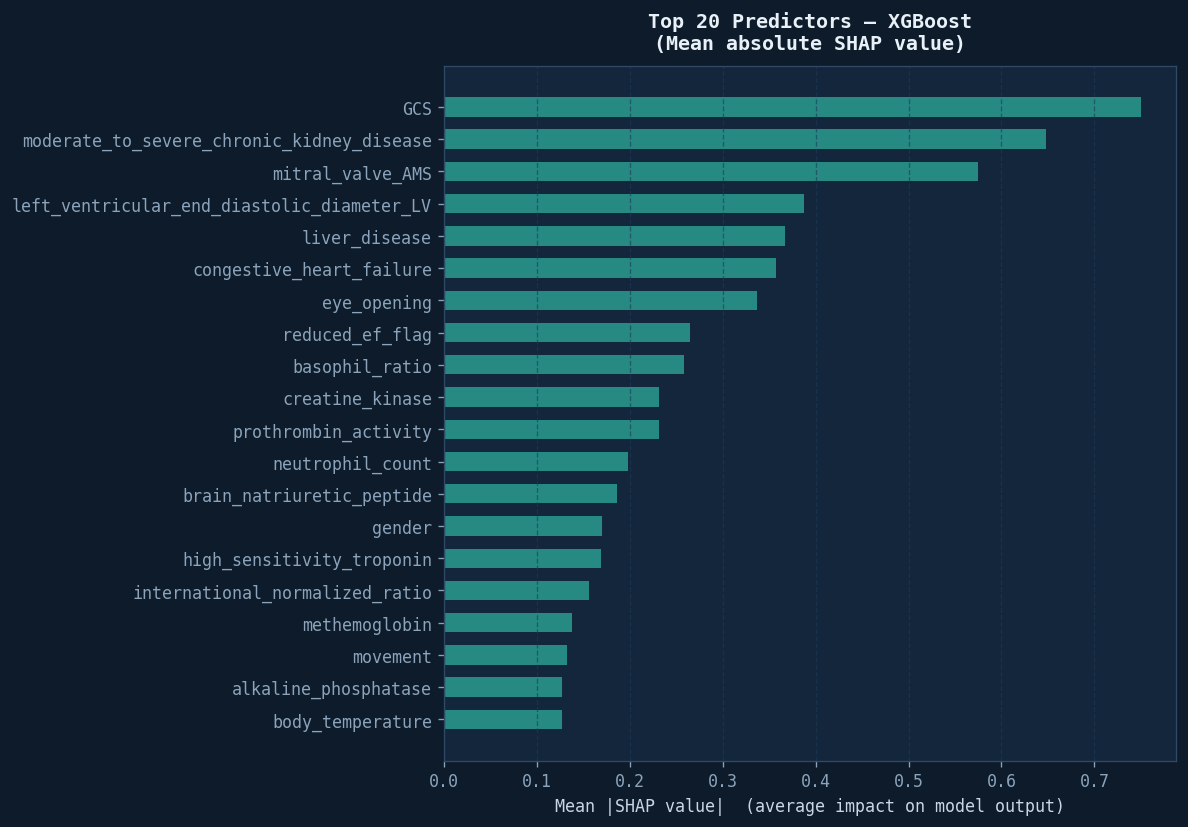
Mean |SHAP| across the held-out cohort — the cardiorenal axis, in descending order.
GCS (Glasgow Coma Scale)
100%
Moderate–severe CKD
88%
Mitral valve AMS
78%
LV end-diastolic diameter
72%
Liver disease
66%
CHF history
60%
Eye opening (GCS sub-score)
54%
Reduced EF flag
48%
Basophil ratio
42%
Creatine kinase
36%
Why dischargeDay had to go
Day-of-discharge correlates with when the record was written, not with the patient. It inflated every horizon. Removing it cost 0.109 AUROC at six months — and bought a model that means what it says.
A note on GCS
GCS tops the chart partly because it is 15 for 97.2% of patients — its signal is mostly "is it ever low?". The model uses it; the explainer should say so plainly.
External validation
Transportability to MIMIC-IV.
The model was trained on Zhang cohort records and applied to 42,990 MIMIC-IV admissions with no retraining — a transportability check, not a clinical claim.
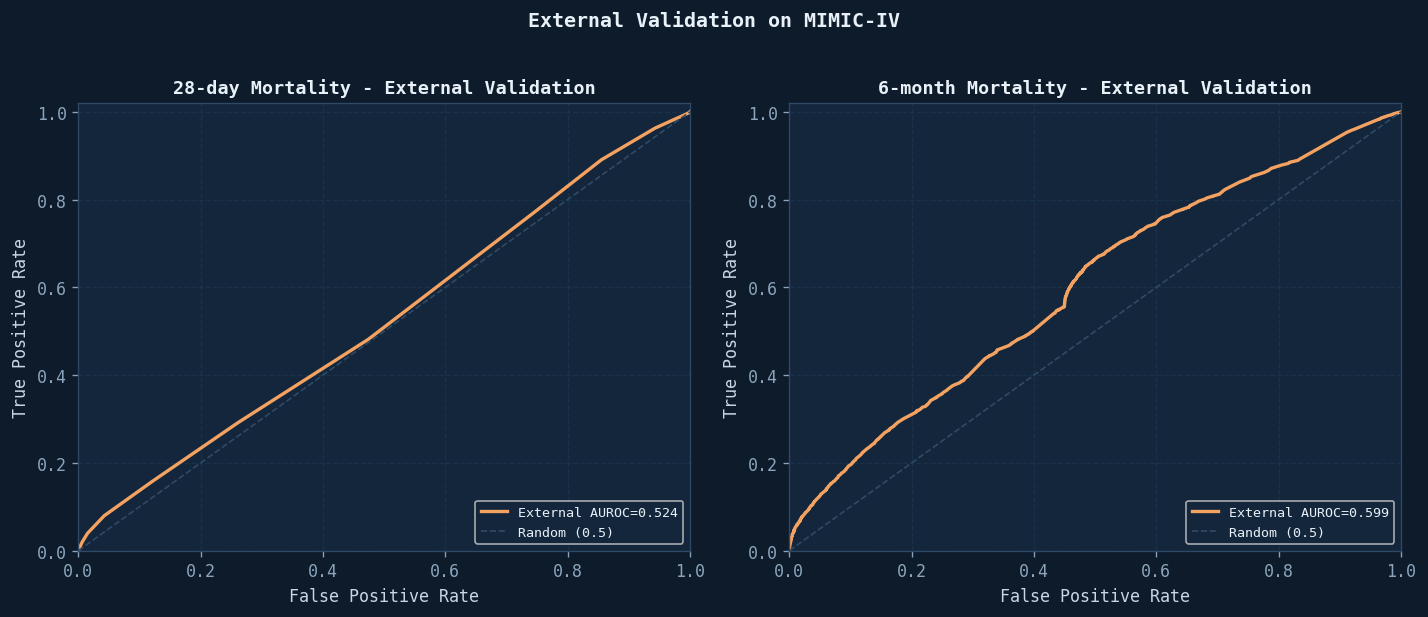
A 54% drop under true domain shift is close to chance for the 28-day horizon — reported as a transportability check, not a clinical claim. Retraining on local data is the honest next step.
Evaluation
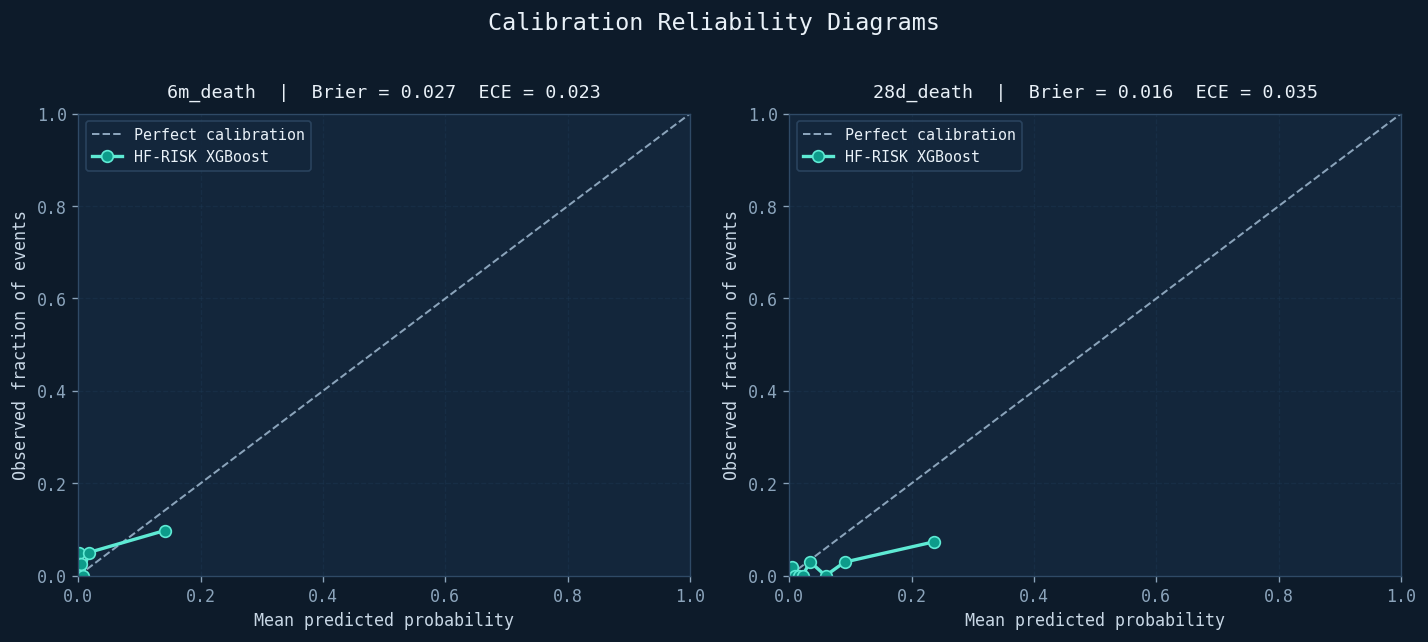
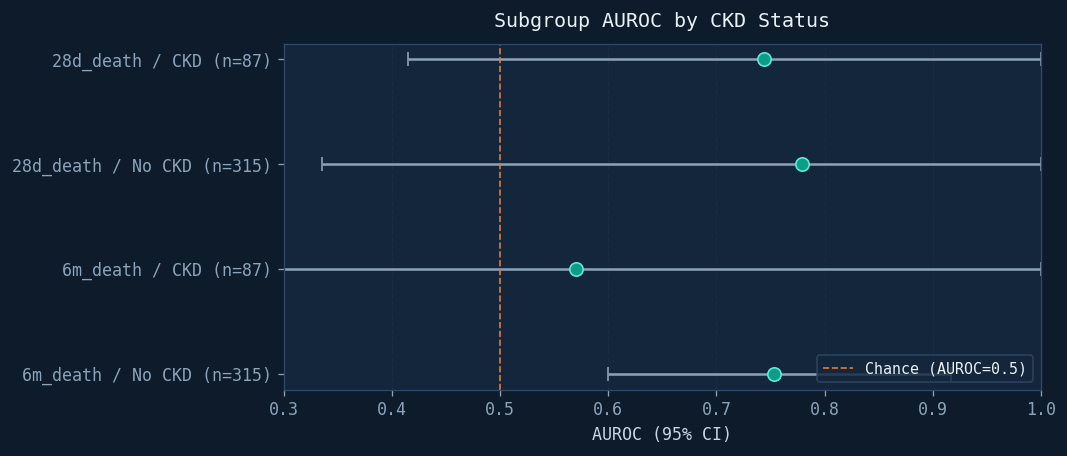
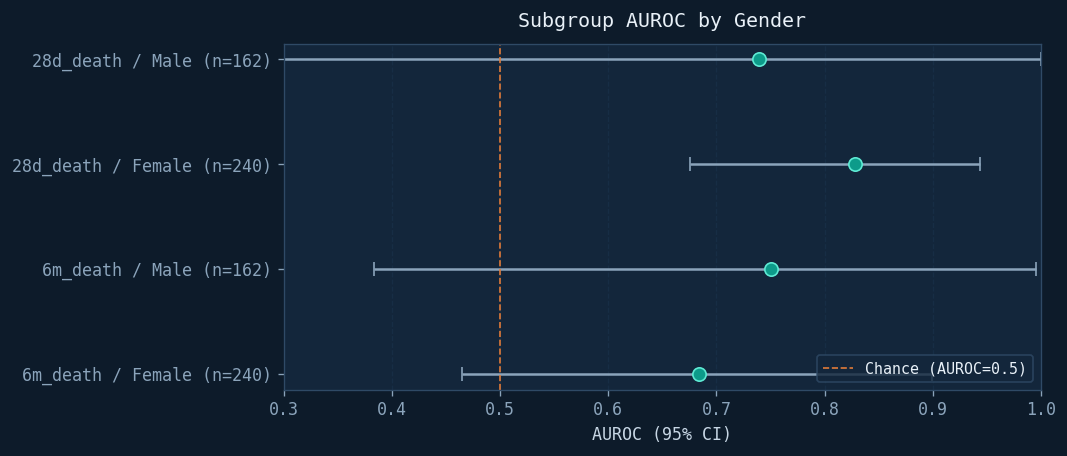
Calibration, DCA, and subgroup checks.
A model is only as good as its worst-calibrated decile. Brier 0.027, ECE 0.023.
Glossary
Terms, plainly.
BNP
Range 2.7–5,000 pg/mL in this cohort; danger > 400; mean ≈ 1,280.
LVEF
Healthy 55–70%; reduced < 40%; missing for 68% — imputed with MICE.
NYHA
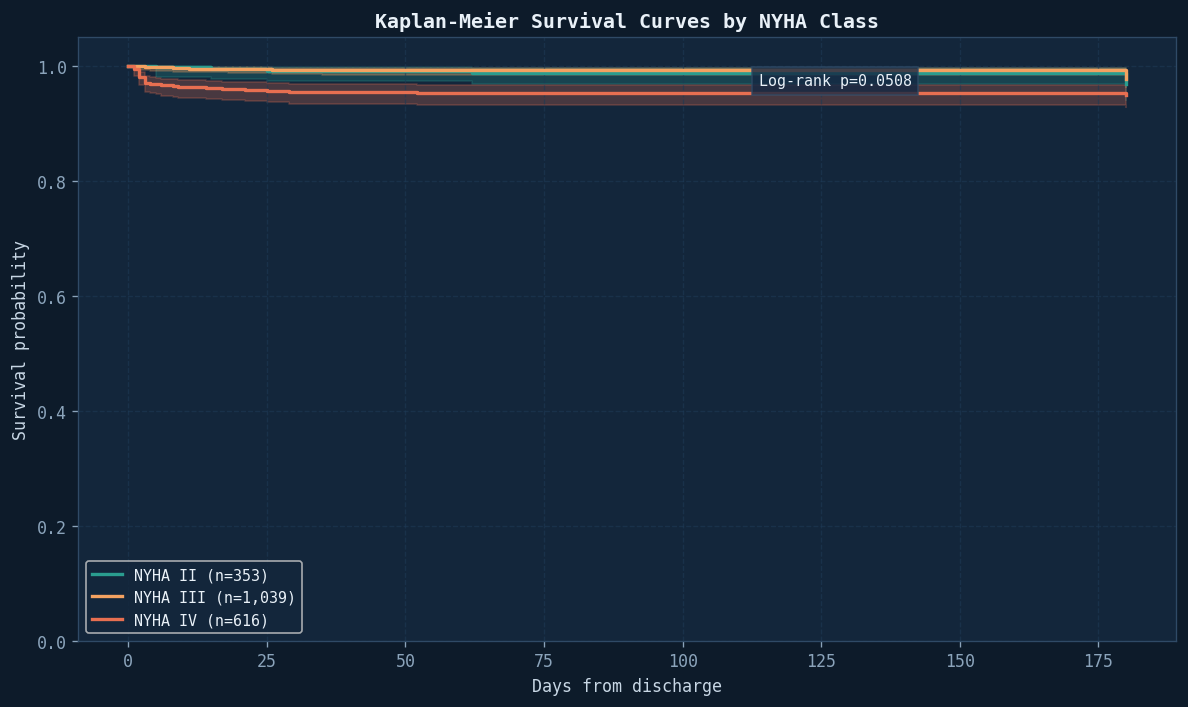
Class I–IV heart-failure severity; 52% Class III, 31% Class IV here.
AUROC
Chicco & Jurman benchmark ≈ 0.73 for this dataset; final 0.710 at six months.
SHAP
Game-theory attributions: how much each feature moved this prediction.
MICE
Multivariate imputation by chained equations — used on 42 variables.
References
Five sources, no padding.
- Zhang et al. (2021). Heart failure clinical records. Scientific Data 8:46. doi:10.1038/s41597-021-00835-9
- Goldberger et al. (2000). PhysioBank, PhysioToolkit, and PhysioNet. Circulation 101(23), e215–e220.
- Johnson et al. MIMIC-IV. PhysioNet.
- Chicco & Jurman (2020). The advantages of the Matthews correlation coefficient. BMC Med Inform Decis Mak 20:16 — baseline AUC ≈ 0.73.
- Lundberg et al. (2020). SHAP. Nature Machine Intelligence.